Accountability
Reporting
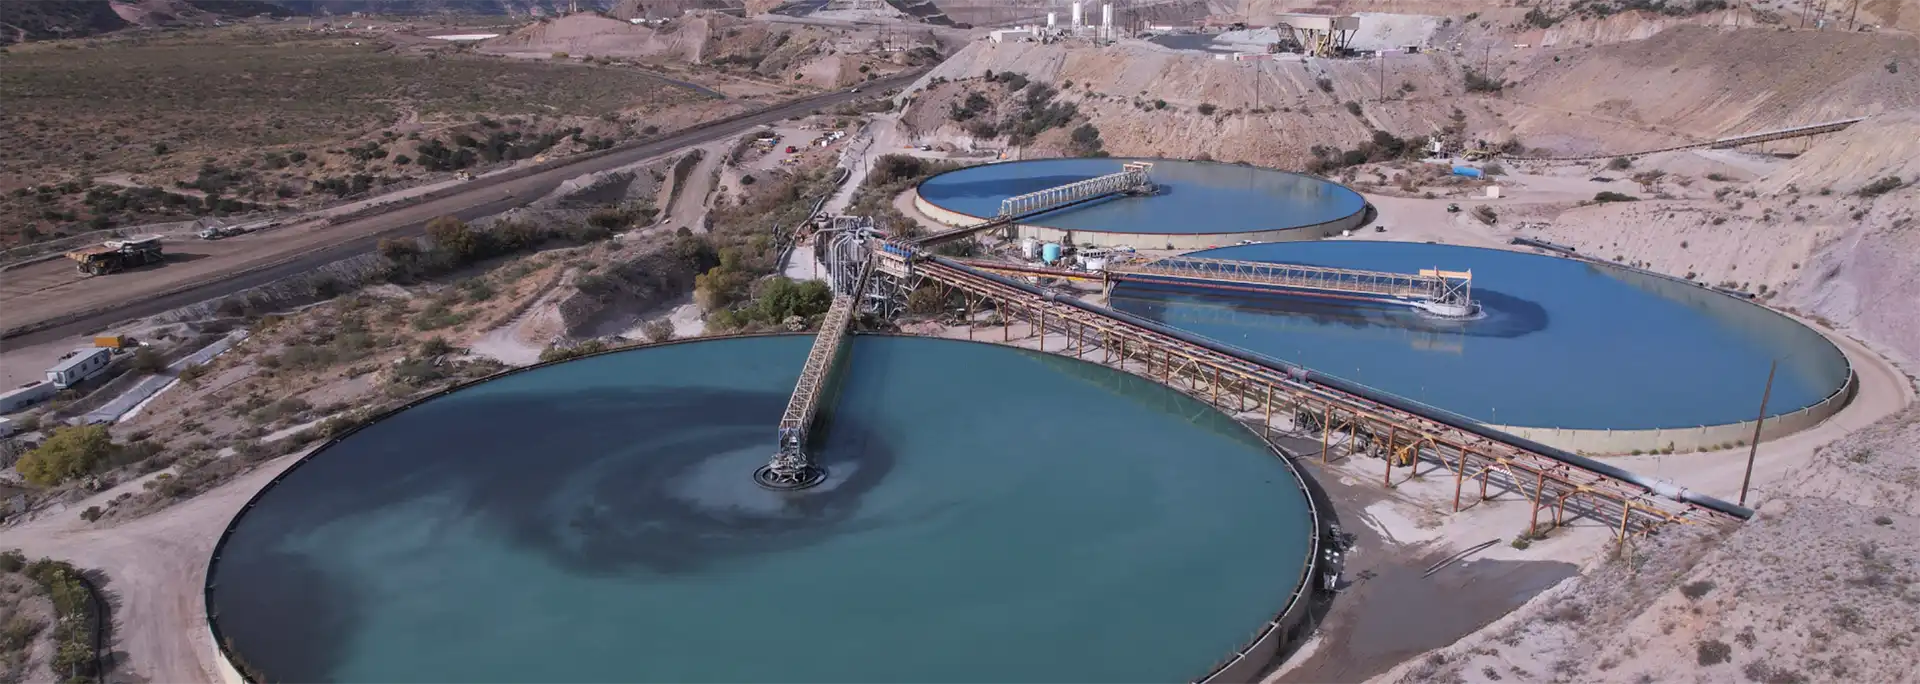
Through our robust sustainability reporting practices, we provide transparent, detailed information on our ESG performance.
Transparency and Continuous Improvement
We are transparent about risks and opportunities, provide stakeholders with insight into our operations, and consistently assess our performance. Reporting is also a key tool for continuous improvement.
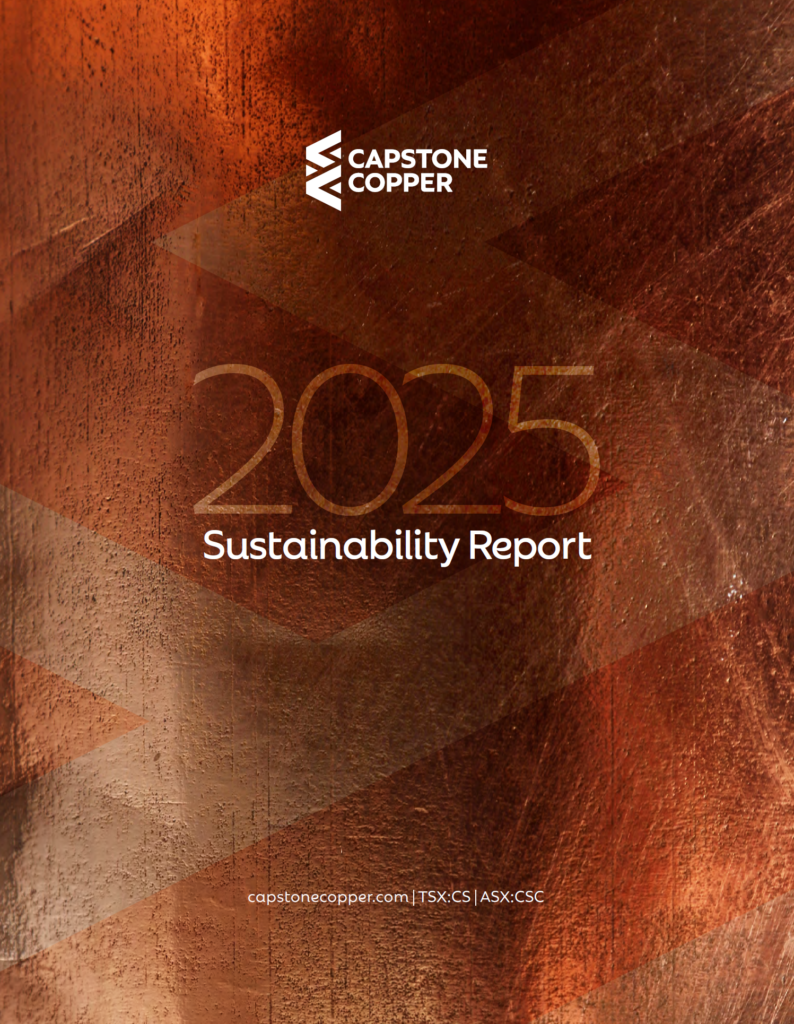
2025 Sustainability Report
“Our 2025 Sustainability Report demonstrates the ways we are embedding sustainability in how we plan, operate, and grow our business for the long term. We made progress on implementing our Sustainable Development Strategy across all sites, achieving two of our targets, adopting new standards, and improving transparency through public disclosures.” – CEO, Cashel Meagher
How We Manage Sustainability Fact Sheets
Our How We Manage fact sheets describe Capstone’s management approach to sustainability – how we oversee, manage and monitor risks and impacts related to our ten material topics.
Alignment with Standards and Disclosures
At Capstone, we report our sustainability performance in alignment with various international reporting standards and voluntarily participate in industry initiatives that provide a structure to assess and improve performance, as well as an opportunity for collaboration around best practices within our industry.
Our commitment to these standards and initiatives ensures we provide transparent, detailed information about our sustainability performance and continue to improve on our sustainability metrics over time, fostering a culture of accountability throughout our organization.
The reporting standards and industry initiatives are outlined below.
Global Reporting Initiative (GRI)
The GRI is an independent not-for-profit organization that leads a global multi-stakeholder process to develop and refine rigorous yet practical sustainability reporting. The widely used GRI Standards provide the building blocks for transparent reporting, helping organizations mange risks and opportunities and support strategic decision-making. We prepare our annual Sustainability Report in accordance with GRI Standards.
Sustainability Accounting Standards Board (SASB)
SASB enables organizations to provide industry-based disclosures about sustainability-related risks and opportunities. Capstone reports in accordance with the SASB Metals & Mining Sustainability Accounting Standard Version 2023-12.
Task Force on Climate-Related Financial Disclosures (TCFD)
The TCFD developed voluntary climate-related financial disclosure recommendations that provide investors, lenders, insurers, regulators, policymakers and other stakeholders in the financial markets climate-related information useful to decision making. Capstone publishes TCFD related information in our annual Sustainability Report.
Global Industry Standard on Tailings Management (GISTM)
GISTM strives to achieve the ultimate goal of zero harm to people and the environment. Underpinned by an integrated approach to tailings management, the Standard aims to prevent catastrophic failure and enhance the safety of mine tailings facilities across the globe. Capstone is committed to implementing the GISTM across all TSFs by YE 2028. Information around progress towards conformance can be found in our annual Sustainability Report and on the Tailings Management page of our website.
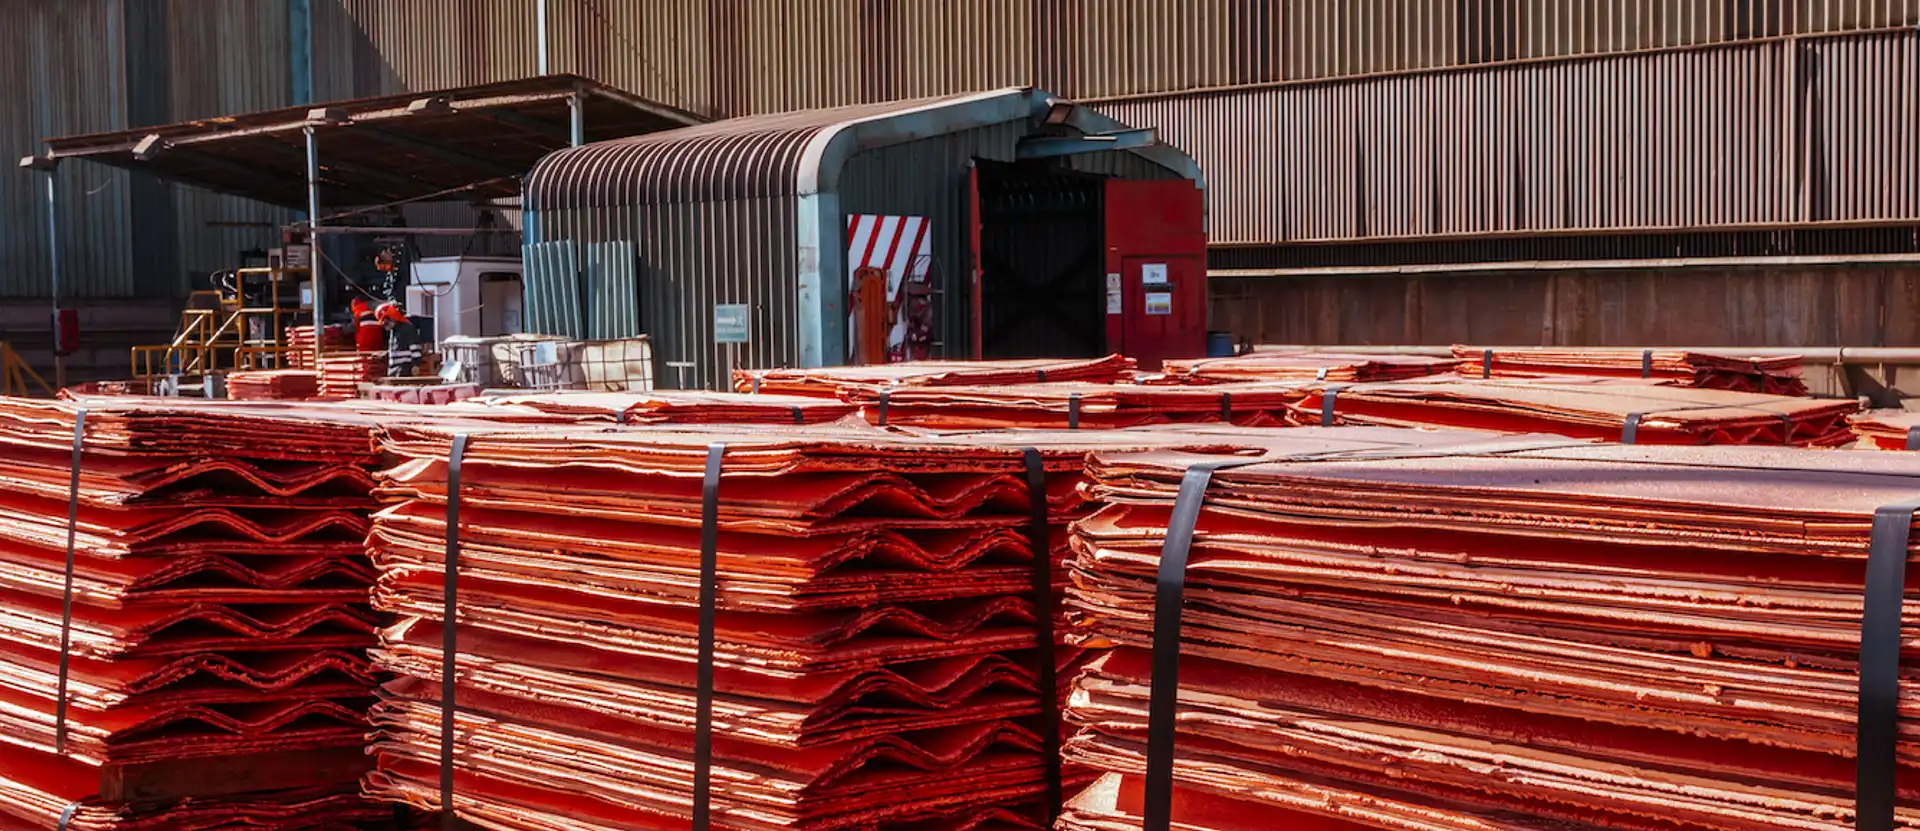
The Copper Mark
The Copper Mark is the leading assurance framework for copper, created to demonstrate responsible production practices and the industry’s contribution to the United Nations Sustainable Development Goals. The Copper Mark uses a rigorous site-level assessment process to independently verify whether individual copper producing sites have responsible production practices using 33 criteria across three areas: Environmental, Social, and Governance. In 2023, Capstone’s Mantoverde and Mantos Blancos sites were awarded The Copper Mark. In 2025, Capstone’s Pinto Valley site was awarded The Copper Mark.